

Note: The following article is based on a Build Equinox report on particulates and particulate management. The full report will be posted on our website and includes details of our analyses and literature citations not contained in the article.
 A haboob is a dust storm of enormous proportion. The dust storm occurring in our homes over the past several decades is more ominous and destructive to our health.
Dust, commonly referred to as “PM” (particulate matter) and “UPF” (Ultra Fine Particulates), is everywhere. You can’t keep particulates out of a house because they are generated inside our homes and buildings as well as infiltrating from outside. Particulates are linked to heart attacks, stroke, lung cancer, respiratory disease (such as asthma), allergic reactions, and overall are bad news.
Our homes have silently shifted from “outside” dust to “inside” dust as we ardently sealed our homes to conserve energy and improve comfort over the past several decades. Today’s indoor dust is more complex than the dust of old, with today’s dust also composed of modern chemicals. The confluence of increased “inside” dust coupled with a complex atmospheric chemical soup has created the perfect dust storm that increasingly impacts our health and well-being. Figure 1 shows trends of home infiltration (NL, “Normalized Leakage” or air exchange rate) and asthma incidence. The two points shown for 2010 represent “good” modern construction with an NL of 0.3/hr and super-sealed (Passive House level) NL of 0.03/hr level ranges. We spend 90% of our time in buildings with a majority of that time in our homes.
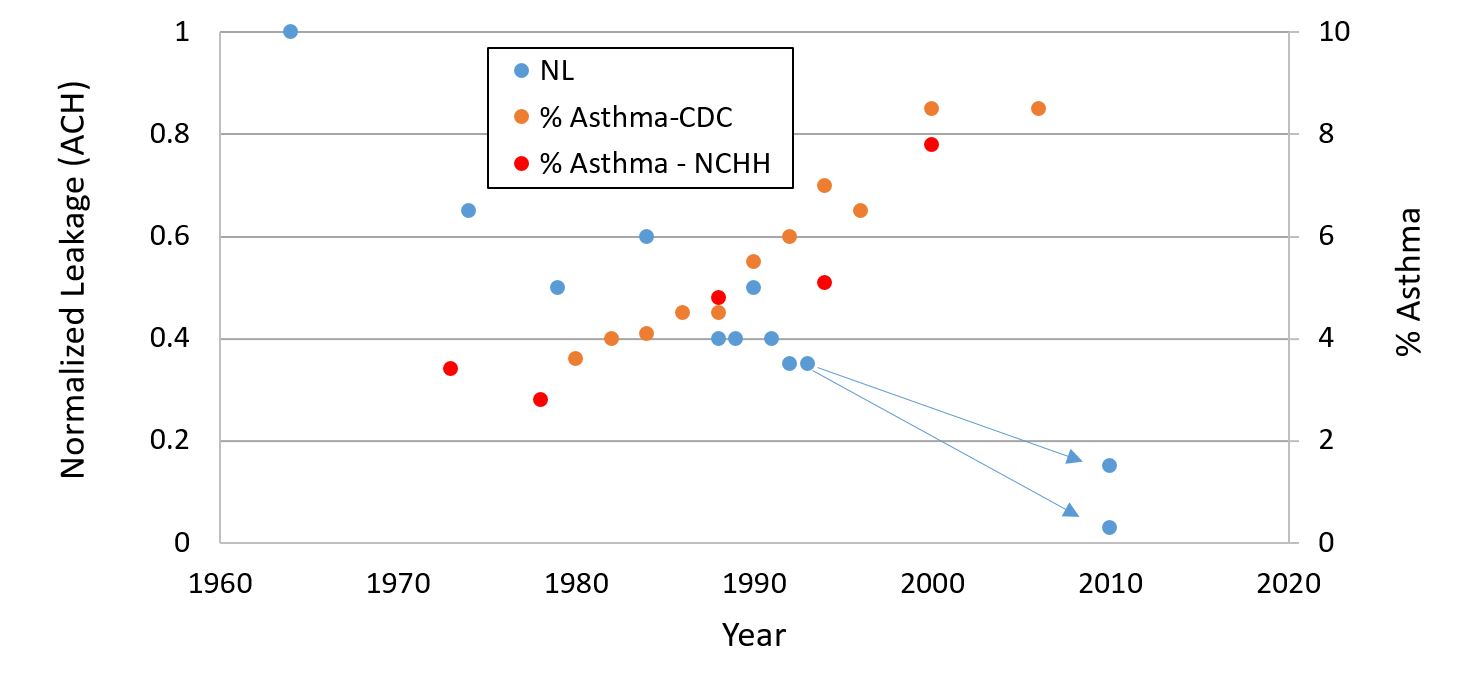 Figure 1: Trends in US residential air exchange rates and asthma incidence.
Figure 2 is a schematic of outdoor particulates infiltrating into a home while a mixture of indoor generated and outdoor particulates are exfiltrated from the home. A broad spectrum of particulate composition, size and shape exists, and we are impacted by these in many ways. Outside particulates are generated naturally (pollens and dirt) and as byproducts of human activity (power plant and vehicular exhausts, road dust, etc). Lawn fertilizers, agriculture herbicides and pesticides adhere to dirt and pollens that infiltrate our homes. Indoor particulates are mostly related to human activity such as desquamation (skin shedding, about 0.5kg or 1 pound per year!), cooking, textile abrasion (lint), molds, dust mite excrement, bacteria, sneeze residue, and cough residue.
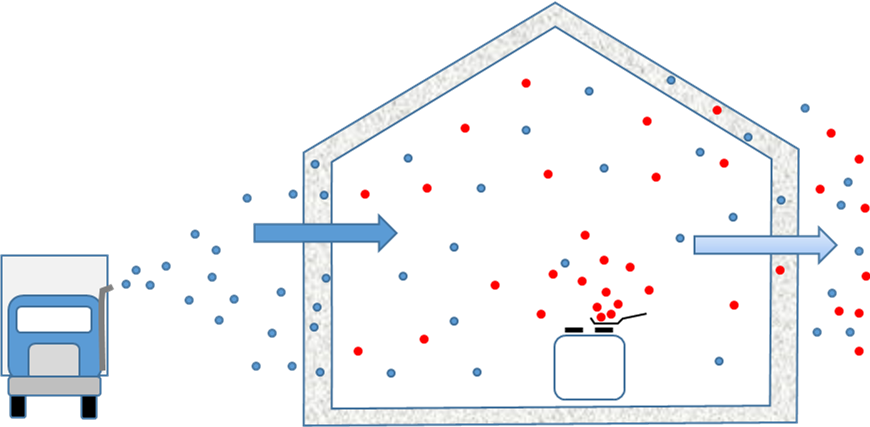 Figure 2: Outside particulates (blue dots) infiltrating into a house while indoor generated (red dots) and outdoor particulates exfiltrate out of the house.
As chemicals vaporize from our furnishings, cleansers, cosmetics and other items, they can combine into solid particulates or become absorbed/adsorbed with a particulate. For example, dust-bound phthalates (“plasticizer” compounds used to make plastics more pliable….often used in toys) correlate strongly with asthma. Radon’s radioactive “daughters” electrostatically “cling” to dust particles. As we inhale radioactive dust, the particulates can stick in our lungs where further radioactive decay damages DNA, potentially causing cancer.
How Much Dust is Too Much?
There is no escaping dust. In addition to outdoor and indoor particulates, we also have our own personal particulate cloud, called the “Pigpen effect” after Charlie Brown’s friend! As in other things, rather than panicking, it is important to mitigate harmful effects by understanding the problem.
Figure 3 is a screenshot of Urbana Illinois pollution levels on January 2, 2017 from the World Air Quality Index project that provides worldwide pollution information. A US EPA site provides similar information for US locations. For the United States (different countries have their own standards), a color coded alert index for 2.5 micron (µm) and 10 micron (µm) sized particulates is shown in Table 1. Associated warnings for the colored coded particulates levels are contained on the air quality websites. How bad can it get? Figure 4 shows Beijing on a “good” day. Beijing often has a particulate AQI (Air Quality Index) exceeding 900! Beijing, Cairo and New Delhi are fascinating cities with beautiful people, delicious foods, and wondrous sites. I hope they will be able to reduce their outdoor air pollution to levels that improves the health of their populaces. When you wipe your brow with a handkerchief and it turns black, as I have in each of these great metropolises, you know that ain’t good.
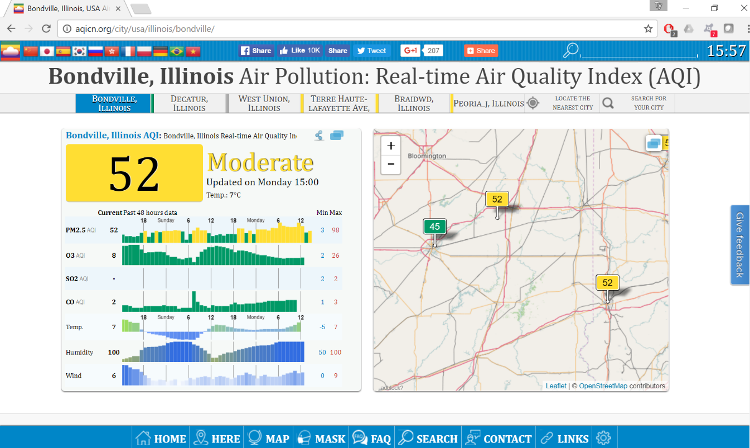 Figure 3: “aqicn.org” air quality website showing air quality near Urbana Illinois on January 2, 2017. PM 2.5 is at moderate levels (12.2 µg/m3) and is the outdoor pollutant level of most concern today.
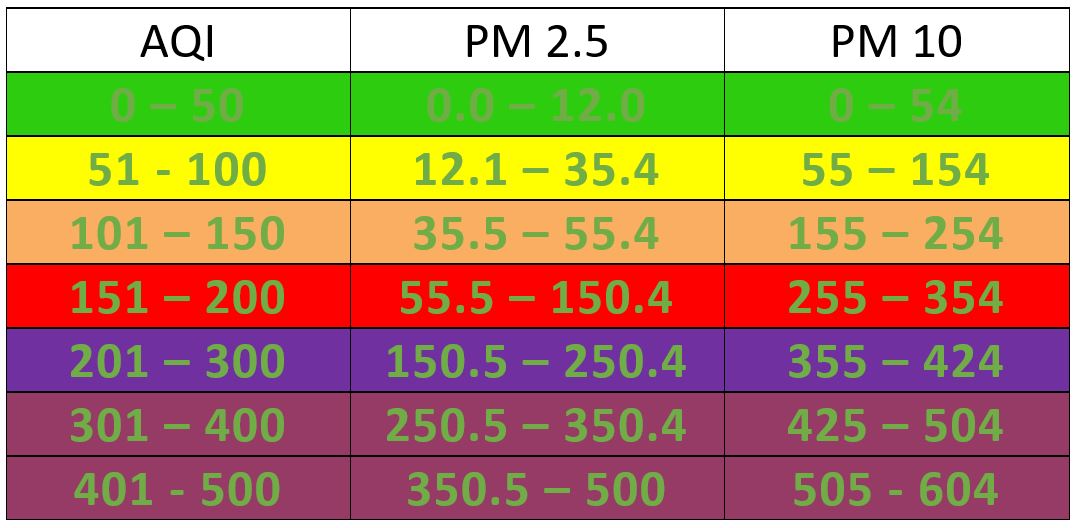 Table 1: Air Quality Index Relation to PM 2.5 (µg/m3) and PM 10 (µg/m3)
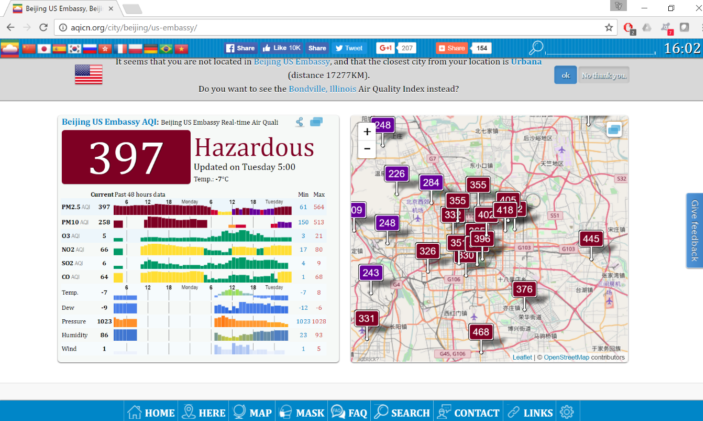 Figure 4: Beijing is often above 300, and sometimes exceeding 900!
The AQI for Urbana’s 2.5 PM (2.5 micron particulates) shown in Figure 2 is 52, which is equivalent to 12.2 µg/m3 of particulates, or just a bit above the lowest level. Most US locations tend to stay below AQIs of 150 (55.4 µg/m3). 2.5pm are particulates that can be inhaled deeply in the lungs, while 10 micron particulates do not make it quite as far (but still cause problems).
What does this mean in practical terms? Assuming a human inhalation rate of 8 liters per minute, 42 milligrams per year of 2.5 micron class particulates are inhaled into our lungs with a particulate density of 10 µg/m3. That’s equivalent to half a “baby” aspirin (see Figure 5). Over many years it adds up, and for the real nasty stuff, just a small bit is bad. Over a lifetime, that small amount would build up to quite a bit of stuff in your lungs, but fortunately, Mother Nature imbued our trachea and bronchial tissue cells with motile cilia (fine, hair-like structures on the cell surfaces) that move with a coordinated upward, wave-like motion that moves mucus and a large fraction of inhaled particles out of our lungs. Any dissolvable particulates or chemicals coating particulates, however, may be absorbed and transported into our bodies instead of being expelled.
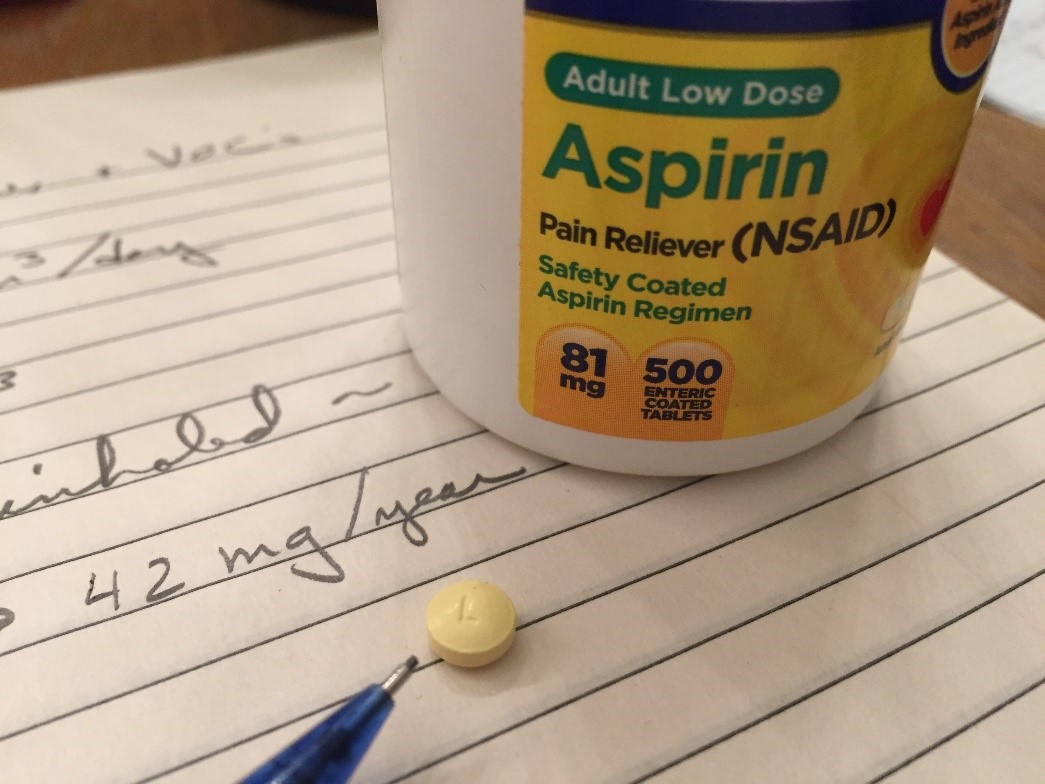 Figure 5: Air with a 2.5 PM density of 10µg/m3 is 42mg, or about half a “baby” aspirin of particulates inhaled per year.
The Good News – Reduced Transport of Outside Particulates Into Our Homes
Leaky homes always have air moving through them, and all homes are leaky. Some homes are very leaky and some homes are not so leaky, but all homes leak air. Varying wind speed and wind direction coupled with temperature differences between the indoors and outdoors impact infiltration rates. Opened windows and doors, attic exhaust fans, cooking hood vent fans, vented clothes dryers, and other powered exhausts further increase air infiltration rates. Particulates are entrained with the flow of outside air into our homes, with some fraction of those particles making it all the way through the cracks and crevices to the inside of homes.
The more a home is sealed, the lower the fraction of outdoor particles transported into the home. That is, as the cracks, construction flaws and other infiltration passageways are reduced, a smaller fraction of particulates are able to stay entrained with the air and flow into the house. In effect, your house acts like a filter, and sealing a home increases its filtration rating! Figure 6 shows how the fraction of outdoor particulates transported into a home has decreased since the 1890’s. Around 1950, as storm windows and insulation grew in popularity, infiltration decreased, with an associated decrease of the fraction of outside particles that are able to stay entrained. Reduced infiltration and the associated increased particulate filtration effect combine to low the overall transport of outside particulates into homes.
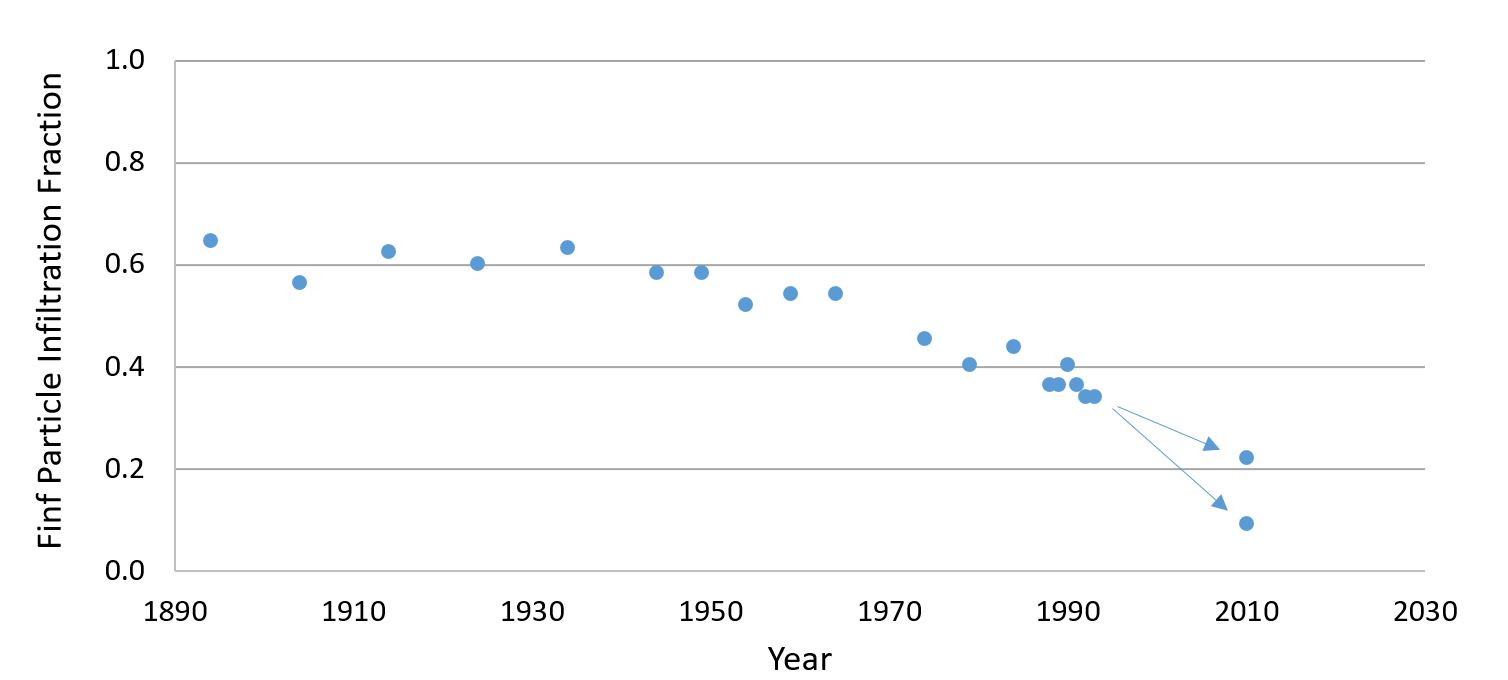 Figure 6: Fraction of outdoor particles infiltrated into a house since 1894.
The Bad news – Increased Indoor Particulate Density In Our Homes
While sealing a home provides energy savings, improved comfort, and reduced flow of outdoor dust into homes, trouble has been brewing inside with drastically increased concentrations of indoor generated particulates and chemical vapors and gases. Figure 7 shows how indoor generated particulate density has changed in a reference to indoor generated particulate density of a home constructed in the 1890’s. The ratio of particulate densities has skyrocketed by more than a factor of 10! The point shown for 2010 is for “good” conventional construction with an NL of 0.3/hr, representing the majority of today’s homes.
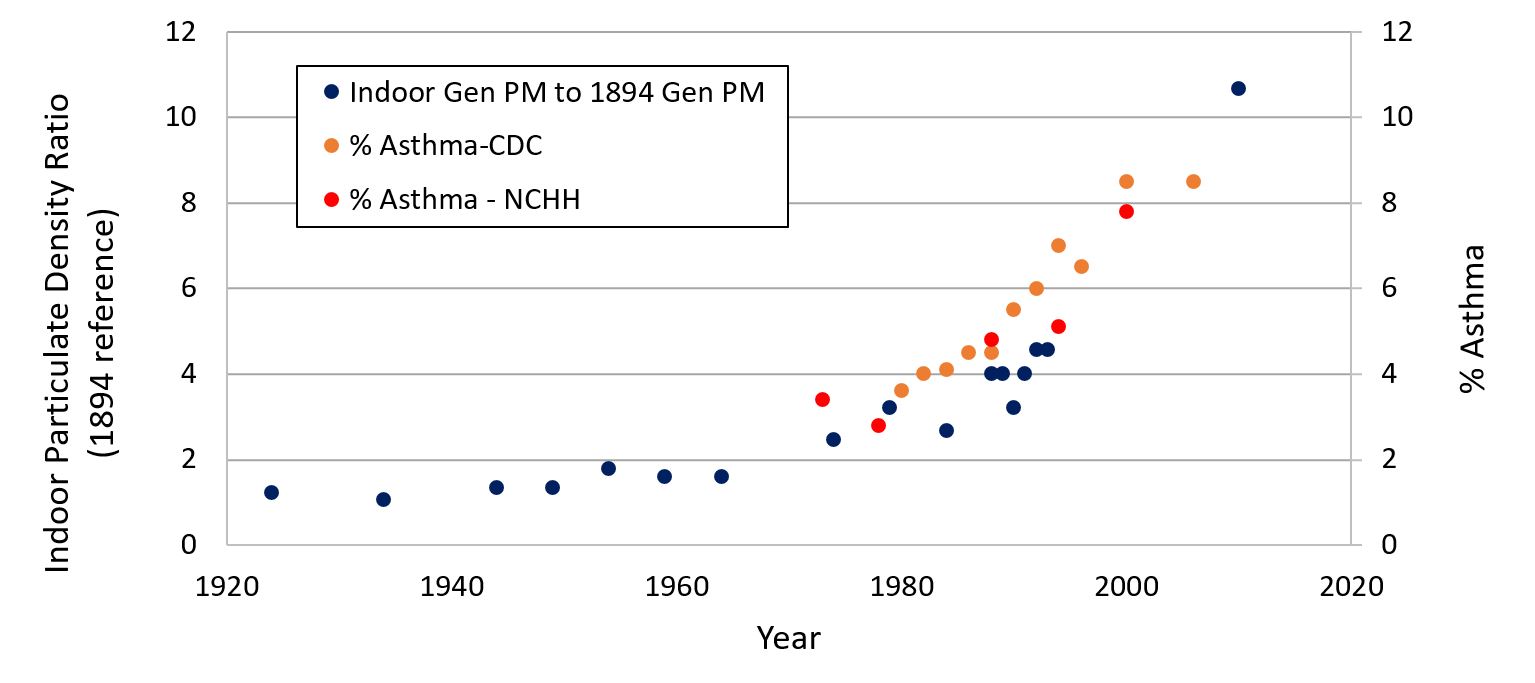 Figure 7: Indoor particulate density ratio (referenced to 1894 indoor particulate density) and asthma incidence plotted since 1920.
Super-sealed homes are not shown in Figure 7, but would increase by another factor of 10. That is, indoor generated particulate densities are 100 times greater in super-sealed homes than homes built in the 1890’s. Figure 7 assumes that the indoor generation rate of particulates in the 1890’s and today are the same, but are they? Home furnishings, clothing, cleansers, cooking, cosmetics, and other daily activity materials have changed substantially. The plastics abraded from the bottom of shoe soles and slippers are different from the leather soles of past centuries. We have largely gone away from Frank Lloyd Wright’s concept of “organic architecture” in which simple materials (stone, concrete, wood, metal and glass) dominate a home’s construction and furnishing materials. Dolls and toy trucks made from phthalate infused plastics rather than bisque, metal and wood generate a different type of indoor particulate. Today’s indoor dust is not your grandparents’ dust.
Also plotted in Figure 7 is the change of asthma over the past several decades. Interestingly, when plotted on a similar scale, indoor generated particulate density and asthma incidence follow the same path. The linkage between the two is quite complex. For example, indoor smoking bans and reduced smoking in the general populace since 2000 may be responsible for a leveling of asthma incidence at the 8-10% level. Correlation of asthma growth and indoor particulate density increase does not mean cause-and-effect. One can show that murder rates and ice cream consumption are correlated. Does ice cream cause murder (or vice versa)? I like ice cream a lot, and if it became scarce, perhaps I would fight to the death for it, but behind both is a linkage to warm weather. We must be careful on assigning blame or cause-and-effect, but can you think of something else in our environment that has changed so drastically over the course of a human generation? Other indoor generated chemicals (gas cooking pollutants, VOCs, SVOCs, etc) have also increased in indoor concentration ratios that follow the same trend as that shown for particulates in Figure 7.
CERV Smart Ventilation Particulate Management
One of the inherent features of the CERV is that it is always filtering your air at a level that effectively limits indoor particulate levels. Fresh air and recirculated air pass through filters with a filtration level of a homeowner’s choosing. Regular filter replacement is essential. Dirty filters become the source of poor air quality while “washable” filters often grow undesirable organisms over time. We recommend that clean replacement filters are regularly installed, generally on a 3 to 6 month basis depending on your respiratory/allergenic sensitivities, time-of-year dust loading, and indoor activity/occupancy level. CERV smart ventilation units use standard size filters available at most big box stores or online shopping sites, keeping filter cost low and convenience high.
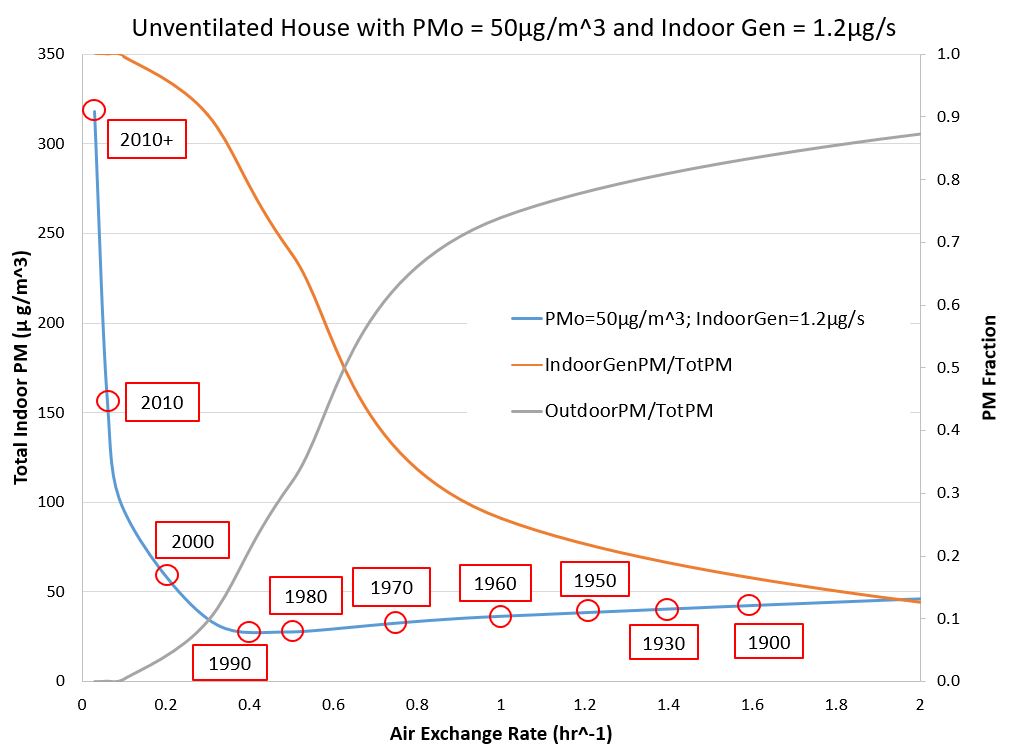 Figure 8: Trend of total indoor particulate level and fraction of indoor generated and outdoor infiltrated particles with outdoor particulate density of 50µg/m3 and indoor particulate generation rate of 1.2µg/s.
Common ventilation strategies suffer from various shortcomings in terms of addressing outside and inside particulates. “Exhaust” ventilation systems as allowed by ASHRAE 62.2, such as attic vents, bathroom exhausts and kitchen exhausts, effectively increase the infiltration rate of a home, which decreases the homes “filtration” efficiency while allowing indoor generated particulates to reach undesirably high levels. ASHRAE 62.2 ventilation standards, which are based on odor rather than indoor air quality, do not address particulates. Continuous flow, “one-and-done” ventilation systems (typical HRV and ERV systems) filter outdoor air, but because they lack recirculation modes, indoor particulates are left untreated and allowed to increase in concentration. “Oscillatory” fresh air vent systems that blow and suck “fresh” air back-and-forth across a home’s volume are even worse. These ventilators temporarily trap indoor particulates on the inside of their filter surfaces while sucking air out of a home, and then blow the particulates back into the house during its blowing mode, keeping indoor particulates suspended and at elevated concentration levels.
CERVs operate at higher air flows than most residential ventilation systems with 150 to 200cfm (cubic feet per minute). When the CERV senses increased pollutant levels (CO2 and VOCs), it automatically brings in fresh air. When indoor air pollutants are at satisfactory levels, the CERV operates in one of its recirculation modes (cooling-dehumidification/heating/non-conditioning). Recirculation is important because the CERV filters all of the home’s air. Under typical home occupancy conditions, the CERV operates in fresh air mode for 25% of the time and is in a recirculation mode for 75% of the time.
Figure 9 compares a home without ventilation to a home with CERV ventilation. The effectiveness of the CERV’s particulate reduction is readily observed in Figure 9 in comparison to homes with ineffective infiltration. The CERV significantly reduces indoor particulate levels regardless of a home’s infiltration characteristics.
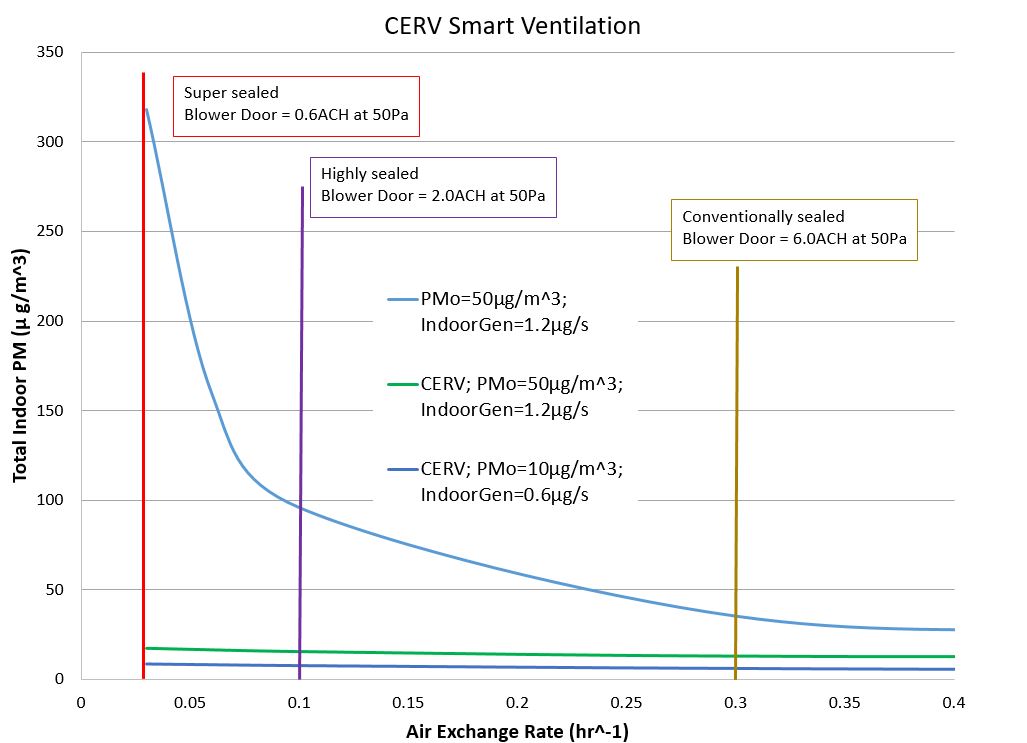 Figure 9: Comparison of unventilated home total indoor particulates versus total indoor particulates with CERV smart ventilation.
Summary
Particulates must be managed in modern homes by ventilation systems such as the CERV Smart Ventilation system that removes outdoor particulates from fresh air and removes indoor (outdoor and indoor generated) particulates through recirculation. It is quite clear that the increasing trends of indoor generated particulate density and asthma are coincident, and that effective reduction of indoor generated particulate densities will help reverse this horrible trend.
Our full Build Equinox report on indoor particulate density will be available on the Build Equinox website. Included in the report are basic data used to derive relations for outdoor particulate transport into homes, indoor generation of particulate data, and indoor particulate balance relations. Literature citations are included, as well.